Python Setup ?
A normal R code chunk
library(reticulate)
x = 42
print(x)
## [1] 42
Modify an R variable
In the following chunk, the value of x on the right hand side
is 42, which was defined in the previous chunk.
## [1] 54
A Python chunk
This works fine and as expected.
## 84
The value of x in the Python session is 84.
It is not the same x as the one in R.
Modify a Python variable
## 102
Retrieve the value of x from the Python session again:
## [1] 102
Assign to a variable in the Python session from R:
See the value of y in the Python session:
## [1, 2, 3, 4, 5]
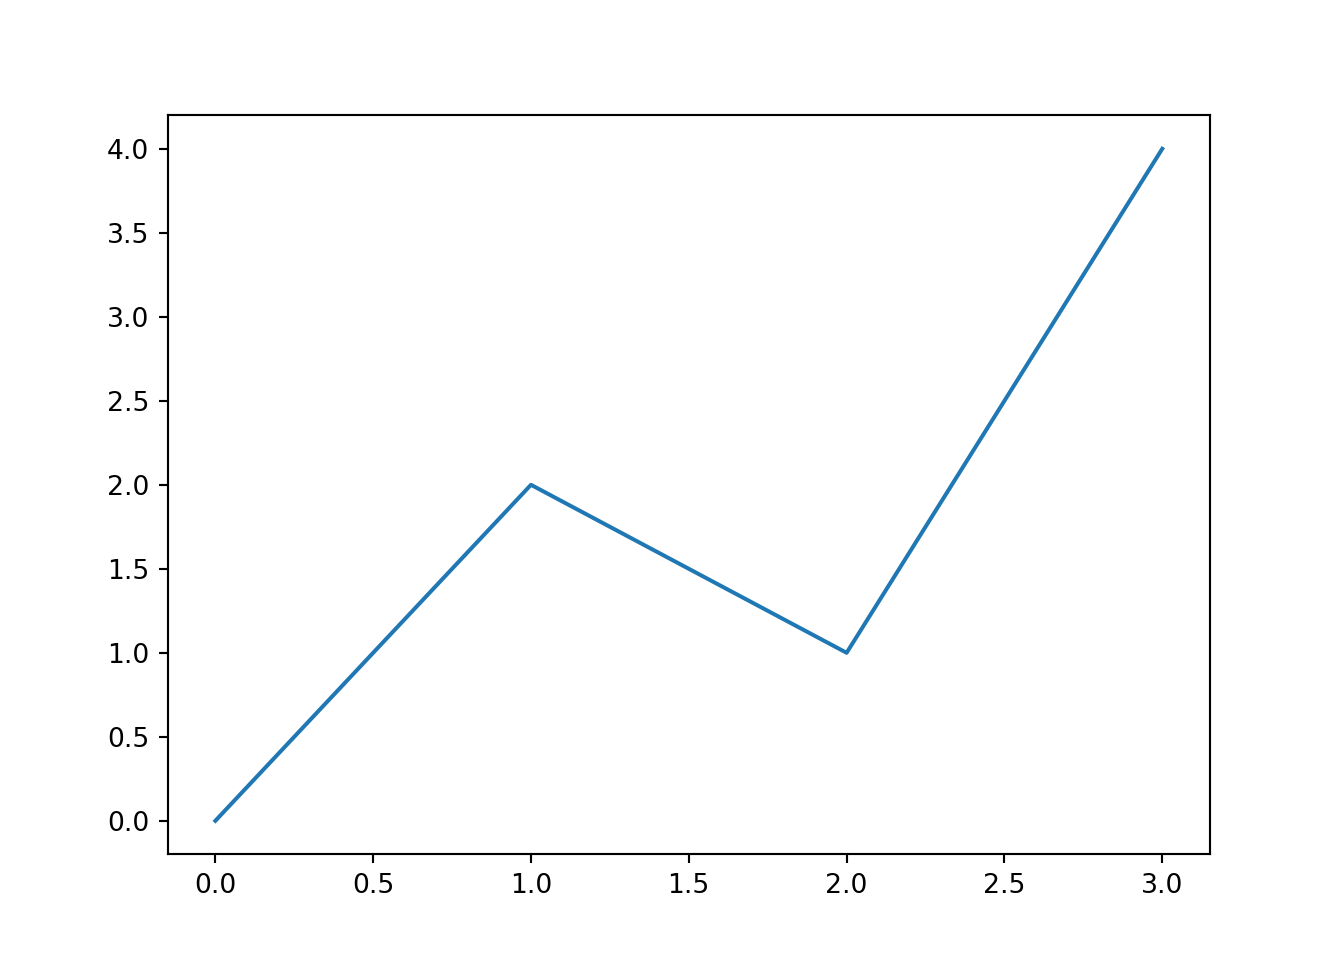
Python graphics
You can draw plots using the matplotlib package in Python.
import matplotlib.pyplot as plt
plt.plot([0, 2, 1, 4])
plt.show()